CARBON DIOXIDE EMISSIONS FOR 2019
In 2019, the Black Country area produced a total of 4,495 Kt CO2 emissions, a decrease of 5.1% (-243 Kt CO2) compared to a decrease of 3.8% nationally since 2018. Carbon dioxide emissions for the Black Country area equated to 3.7 tonnes per capita, below the England average of 4.9 in 2019. Emissions were 12.6 kt per km2 for the Black Country area compared to 2.1 kt per km2 for England in 2019
The report below is a complete overveiw of all carbon dioxide emissions for 2019 compliled and collected by the Black Countyr Consortium.
Summary
- In 2019, the Black Country area produced a total of 4,495 Kt CO2 emissions. This equates to 3.7 tonnes per capita or 12.6 kt per km2; which is below the England average of 4.9 tonnes per capita
but above the England average of 2.1 kt per km2. - Since 2018, carbon dioxide emissions decreased by 5.1% (-243) in the Black Country area compared to a decrease of 3.8% nationally.
- In 2019, transport accounted for the highest proportion of carbon dioxide emissions in the Black Country area at 36.6% (1,646 Kt CO2) of total emissions – below the England proportion of 37.7%. This was followed by domestic emissions at 35.5% of total emissions which was above the England proportion of 28.1%.
Full Briefing
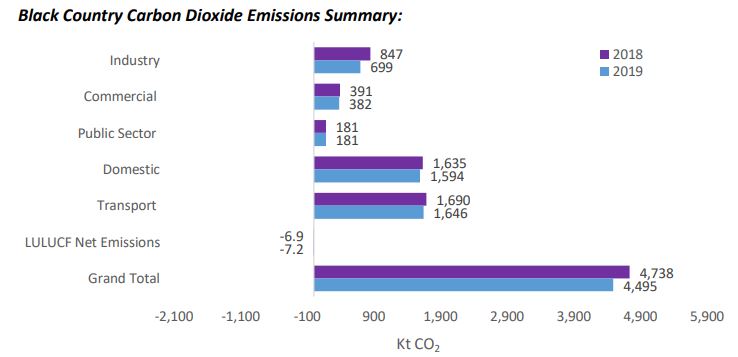
- In 2019, the Black Country area produced a total of 4,495 Kt CO2 emissions, a decrease of 5.1% (-243 Kt CO2) compared to a decrease of 3.8% nationally since 2018. Carbon dioxide emissions for the Black Country area equated to 3.7 tonnes per capita, below the England average of 4.9 in 2019. Emissions were 12.6 kt per km2 for the Black Country area compared to 2.1 kt per km2 for England in 2019.
- Emissions are broken into six main categories, as seen in the following chart. In 2019, transport accounted for the highest proportion of carbon dioxide emissions in the Black Country area at 36.6% (1,646 Kt CO2) of total emissions – below the England proportion of 37.7%. This was followed by domestic emissions at 35.5% (England 28.1% of total), industry at 15.6% (England 21.1%), commercial at 8.5% (England 9.6%) and the public sector with 4.0% of the total emissions (England 3.7%). In contrast, the Land Use, Land Use Change and Forestry (LULUCF) net emissions reduced the total by -0.2% (England -0.3% of total).

- In 2019, Dudley produced a total of 1,127 Kt CO2 emissions, a decrease of 4.6% (-55 Kt CO2) since 2018. Carbon dioxide emissions Dudley equated to 3.5 tonnes per capita or 11.5 kt per km2 in 2019.
- In 2019, Sandwell produced a total of 1,394 Kt CO2 emissions, a decrease of 4.8% (-71 Kt CO2)since 2018. Carbon dioxide emissions for Sandwell equated to 4.2 tonnes per capita or 16.3 kt per km2 in 2019.
- In 2019, Walsall produced a total of 1,048 Kt CO2 emissions, a decrease of 6.6% (-74 Kt CO2) since 2018. Carbon dioxide emissions for Walsall equated to 3.7 tonnes per capita or 10.1 kt per km2 in 2019.
- In 2019, Wolverhampton produced a total of 925 Kt CO2 emissions, a decrease of 4.5% (-43 Kt CO2) since 2018. Carbon dioxide emissions for Wolverhampton equated to 3.5 tonnes per capita or 13.3 kt per km2 in 2019.
Total Emissions by category (measured in Kt CO2), per capita and per kilometre for the Black Country, West Midlands region and England in 2019:
